Connect Power BI to the Dimension Four API
Connecting third-party software to the Dimension Four API is not only easy but can also be done very quickly. And in our series of articles on integrations, we are today going to take a closer look at Microsoft Power BI, and guide you through how you can establish a connection in just a matter of minutes!
First out in the series was Grafana and you can read more about that application in one of my other blog posts.
Power BI is a collection of software services, apps, and connectors that work together to turn your unrelated sources of data into coherent, visually immersive, and interactive insights. Your data may be an Excel spreadsheet or a collection of cloud-based and on-premises hybrid data warehouses. Power BI lets you easily connect to your data sources, visualize and discover what's important, and share that with anyone or everyone you want. (source: https://docs.microsoft.com/)
So why not put Dimension Four and all your IoT data into the mix to gain even more insight into your reports?
To connect the Dimension Four GraphQL API to Power BI you will use the Power Query M code script, and in the following step-by-step guide you’ll find out how to set up Dimension Four as a data source in Power BI.
To get started:
- Install Power BI Desktop (microsoft.com/)
- Obtain Dimension Four tenant id, tenant key, and GraphQL Endpoint.
Step 1. Get Dimension Four Endpoint details
Url/endpoint: https://iot.dimensionfour.io/graph
Tenant id and key:
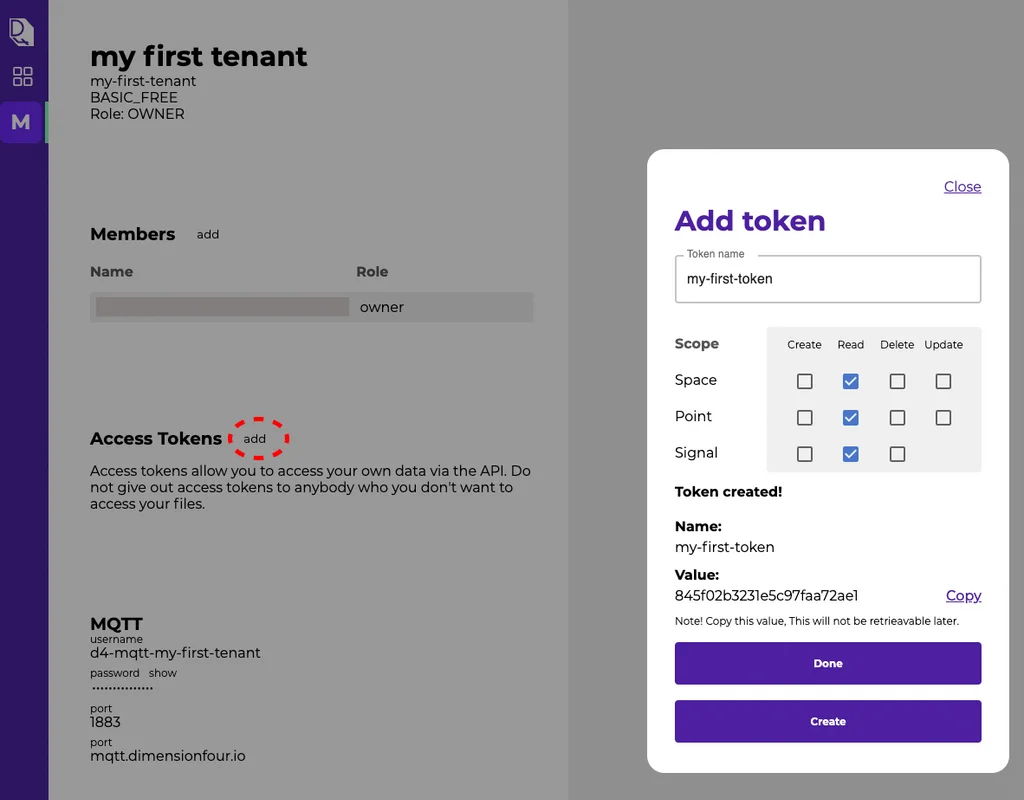
Log in to your Dimension Four account (dashboard.dimensionfour.io) to find your tenant id and create a new access token.
You can also access the same information through our API. Go to docs.dimensionfour.io for more information.
Make sure to make a copy of the displayed token because it is not possible to retrieve it later. (but you can of course create a new one and delete the old one if one goes missing.)
Step 2: Open Power BI and create a Power Query
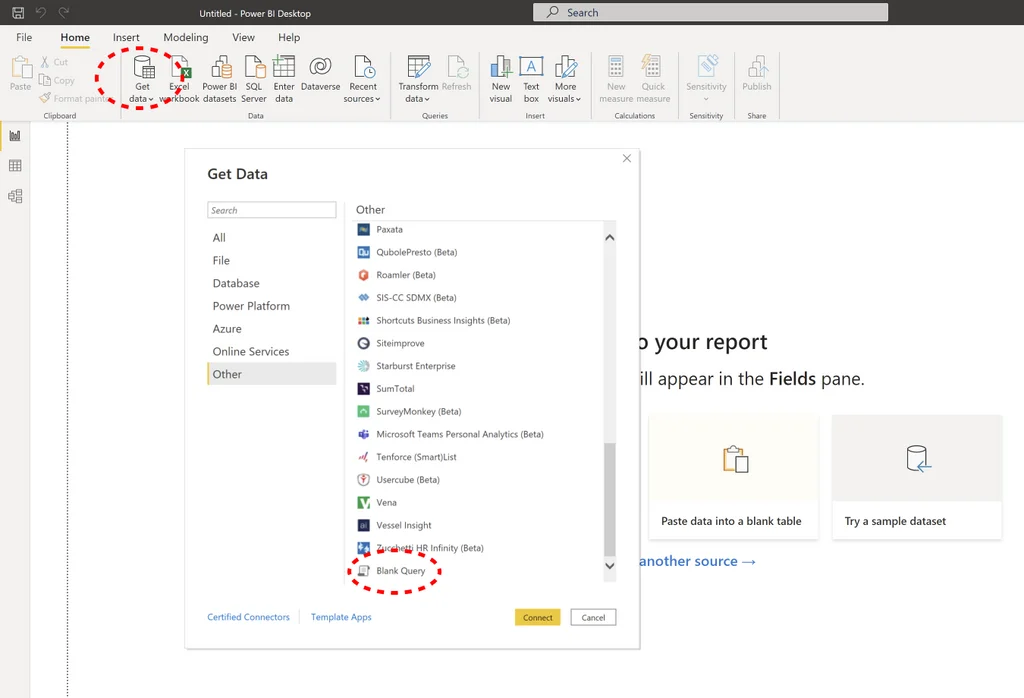
The first thing we need to do is to open a “Blank Query” in PowerBI.
- You’ll find this option under Get Data → Other → Blank Query
Step 3: Write the M script to connect to GraphQL endpoint
1 - Go to “Advanced Editor”
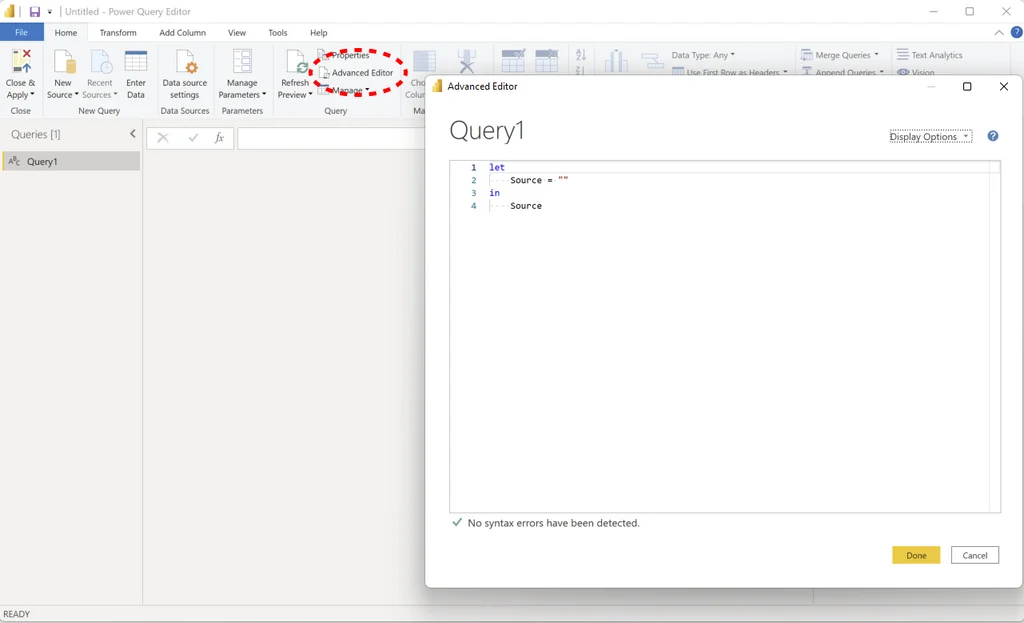
2 - Copy/Paste one of the templates below and
- add tenant-id to the tenant_id variable.
- add tenant-key to the tenant_key variable.
- adjust the graphql query to your needs.
Template/Example 1: (retrieve all points from the tenant and display PointId and PointName.)
let
url = "https://iot.dimensionfour.io/graph",
tenant_id = "your-tenant-id-here",
tenant_key = "your-tenant-key-here",
Source = Web.Contents(
url,
[
Headers=[
#"Method"="POST",
#"Content-Type"="application/json",
#"x-tenant-id"=tenant_id,
#"x-tenant-key"=tenant_key
],
Content=Text.ToBinary("{""query"": ""{points{id name}}""}")
]
),
#"JSON" = Json.Document(Source)
in
JSON
Note! If you need to use quotation marks inside your graphql query, add \" in front of the quotation mark.
Example:
Content=Text.ToBinary("{""query"": ""{points(where:{spaceId:{_EQ:\""1234567890\""}}){id name}}""}")
Once you hit "Done" your query will run and you should see the data entry with a single “Record” in the query section.

Step 4: Format and Extract the Data
As the whole query has been returned in a nested and raw format, you need to extract and format the data to your needs. Make use of the Power BI data extraction capabilities.
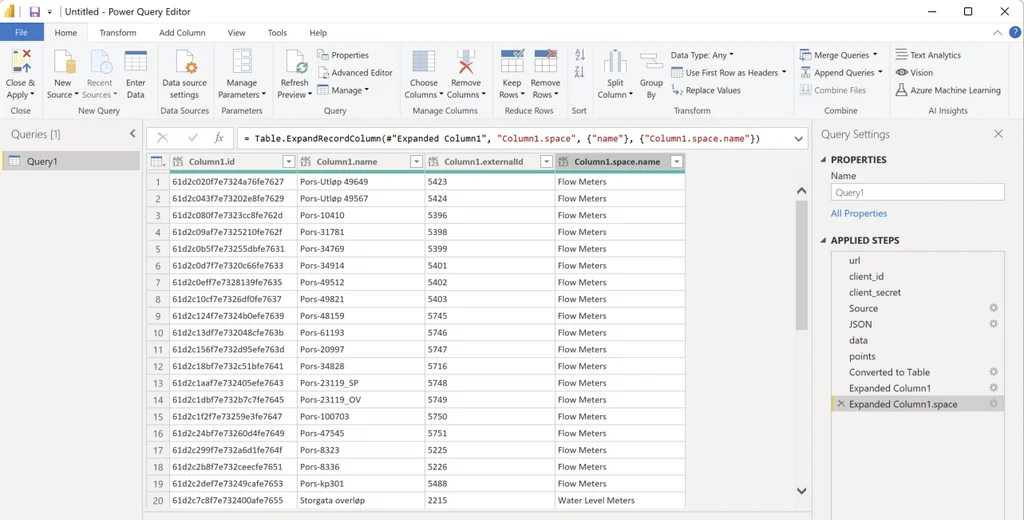
Click on “Close & Apply” and you are now ready to build your graphs!
Step 5: Create Reports
Once your query is ready, you can create Power BI reports from the Dimension Four GraphQL endpoint.