Analyze Data From Your IoT Device With Grafana
Dimension Four allows you to gather all of your IoT sensor data in one place, making it easy to reach from a single endpoint.
It is not uncommon to have large sets of data sitting around, collected from various IoT devices over time. At one point, the data was probably providing value when it was visualized in its proprietary application. Yet as human needs change, instead of simply combining different data sets, you can actually extract more value by looking at collected data as a whole.
Dimension Four allows you to gather all of your IoT sensor data in one place, making it easy to reach from a single endpoint. With the help of GraphQL queries, you can also filter and retrieve the precise data you need. In this way, only your imagination sets limits on the types and combinations of data you want to extract!
A friend of mine has a favorite saying, “the proof is in the pudding”. By this, he means that the best way to see the value in something is by putting it to the test. For me, and when it comes to analyzing data sets, I take this to mean that one should shorten the path from thought to action, wasting no time in seeing if a given application can extract the right information from your collected data.
A handy tool in such a process is Grafana, helping specifically with visualization and analysis. Grafana is a multi-platform, open-source analytics and interactive visualization web application, providing charts, graphs, and alerts for the web when connected to supported data sources. As a visualization tool, Grafana is a popular component in monitoring stacks, often used in combination with time series databases (Wikipedia).
Grafana is well known worldwide and is used by thousands of companies as part of their tech stack. With its extensive library of plugins, Grafana makes it easy to customize an application to your needs.
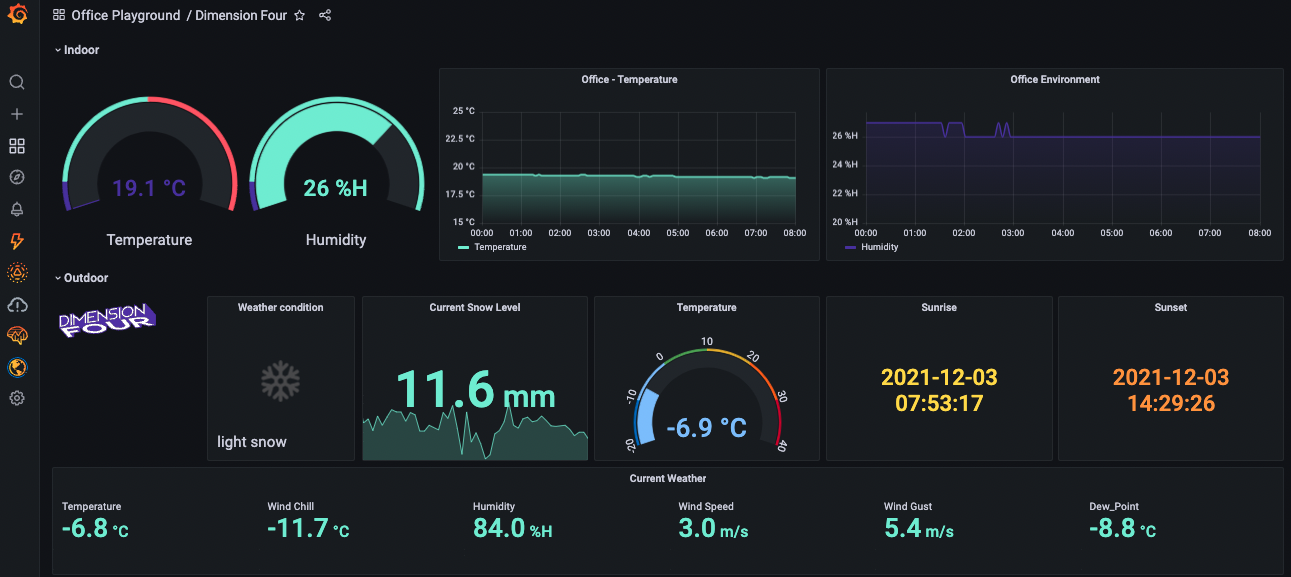
Not seeming too hard to tackle, I - with a modest skill set and a significant portion of curiosity - left the typical data-silo mindset behind. Using Grafana and Dimension Four as my teammates, I worked on combining data from different sensors. Grafana offers a plugin, which allows me to run queries directly in Dimension Fours GraphQL API, and it was just a matter of minutes before beautiful visualizations started to appear on my screen.
Here are the steps I followed:
- Install the plugin “GraphQL Data Source” in Grafana.
- Set up the GraphQL Data Source with a connection to your Dimension Four tenant.
- Create a new dashboard in Grafana, add a panel, choose “Dimension Four” as your data source and query what you want to visualize.
- Choose the right panel type and adjust the graphical visualization to your needs.
- Lean back and enjoy the results!
Seems easy enough? Then why don’t you try it out! Just install the GraphQL DataSource plugin in your Grafana account, and watch the data magic happen.